N ew York City is having a scorching hot summer, as with many other places across the country. Inevitably, we get the news of the spike in homicides and shootings as temperature rises. In 2013, the New York Times looked at the effect of Crime and Weather in the city and beyond, using meta-analysis across multiple publications on the topic. You can read more about there work HERE. Their conclusion?
"episodes of extreme climate make people more violent toward one another."
Using a combination of OpenNYC data along with historical weather measurements by the National Oceanic and Atmospheric Administration, I take a look at the relationship between crime and weather in the borough of Manhattan. The code used for this exploration can be found on my GitHub here.
The Data
The NYPD Complaint Data comprises of all felony, misdemeanor, and violation crimes reported to the NYPD from January 2006 to June 2018 (Updated Yearly). Information detailing the type of complaint, time, and location (from Precinct Level Identifiers to Lat/Longs) are presented for exploration and analysis.
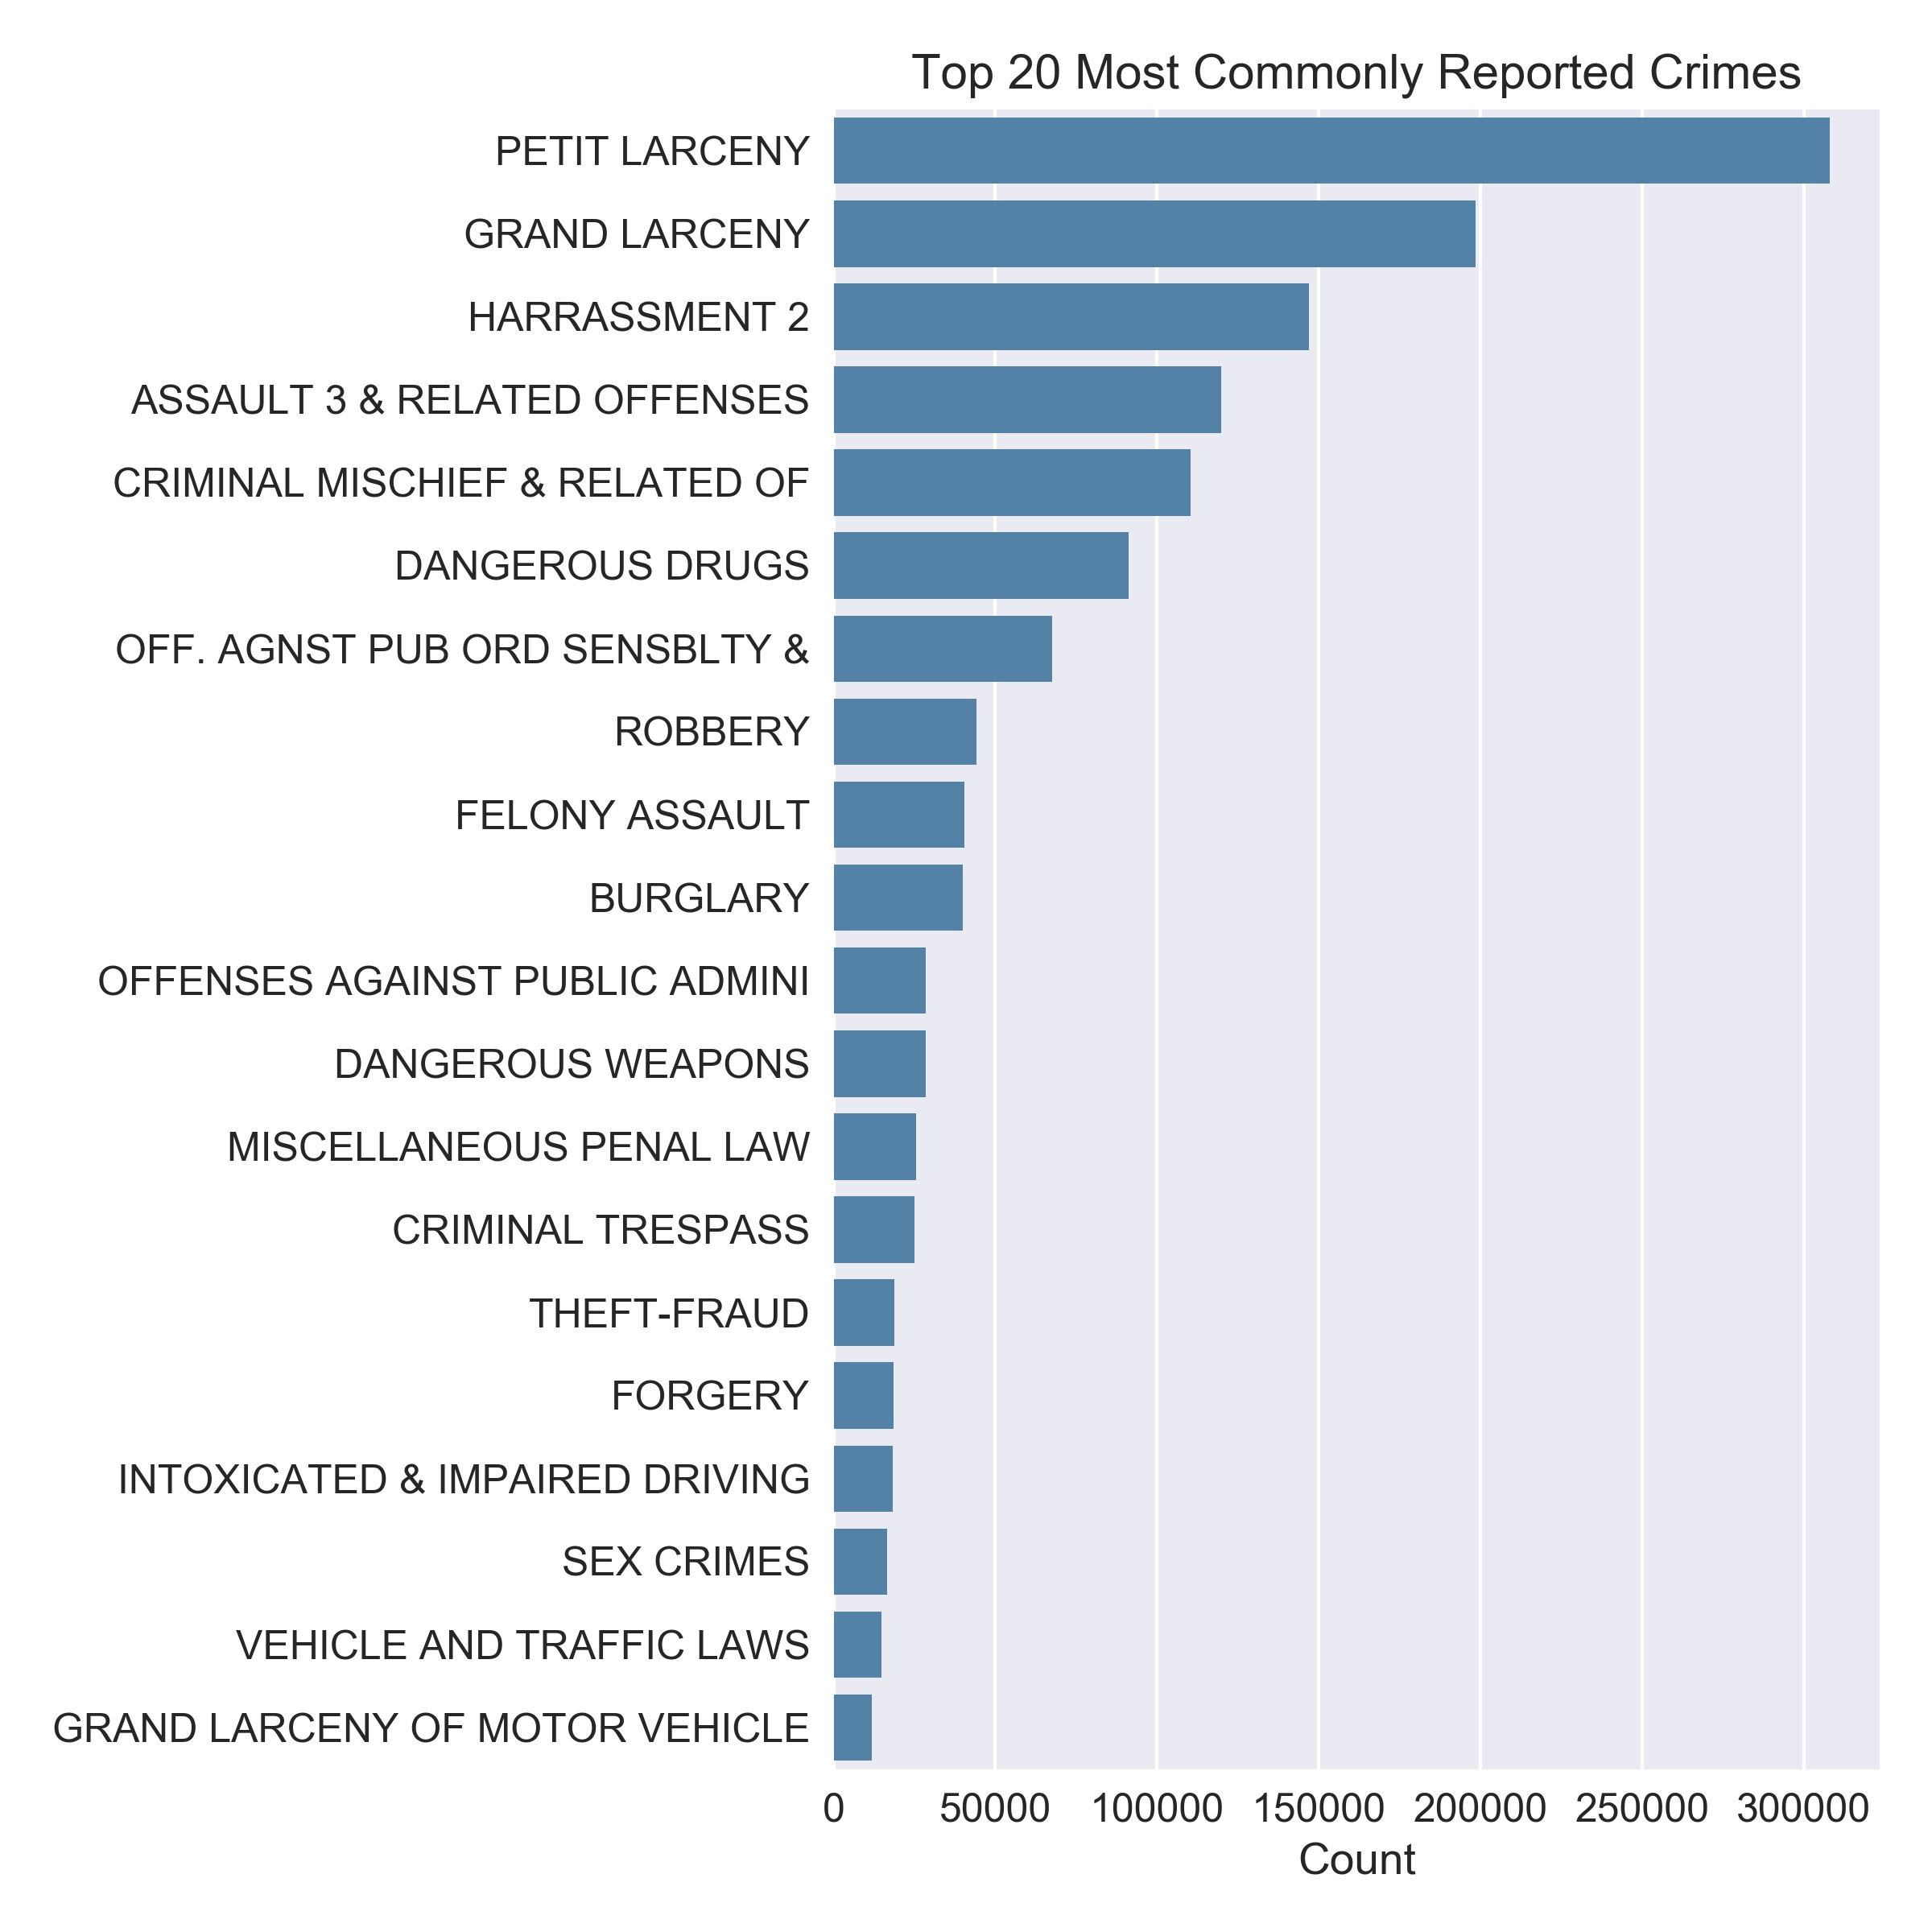
Filtered through to only the borough of Manhattan, there are some 1.4 Million recorded violations
during this period. These reports can be broken down into 72 unique types of offenses. Some offenses
like larceny, harrassment, and assults are categorized based on severity, and for now I've left them
as is without combining them into broader groups. Of the 72 types of violations, the top
twenty most frequent ones are listed below:
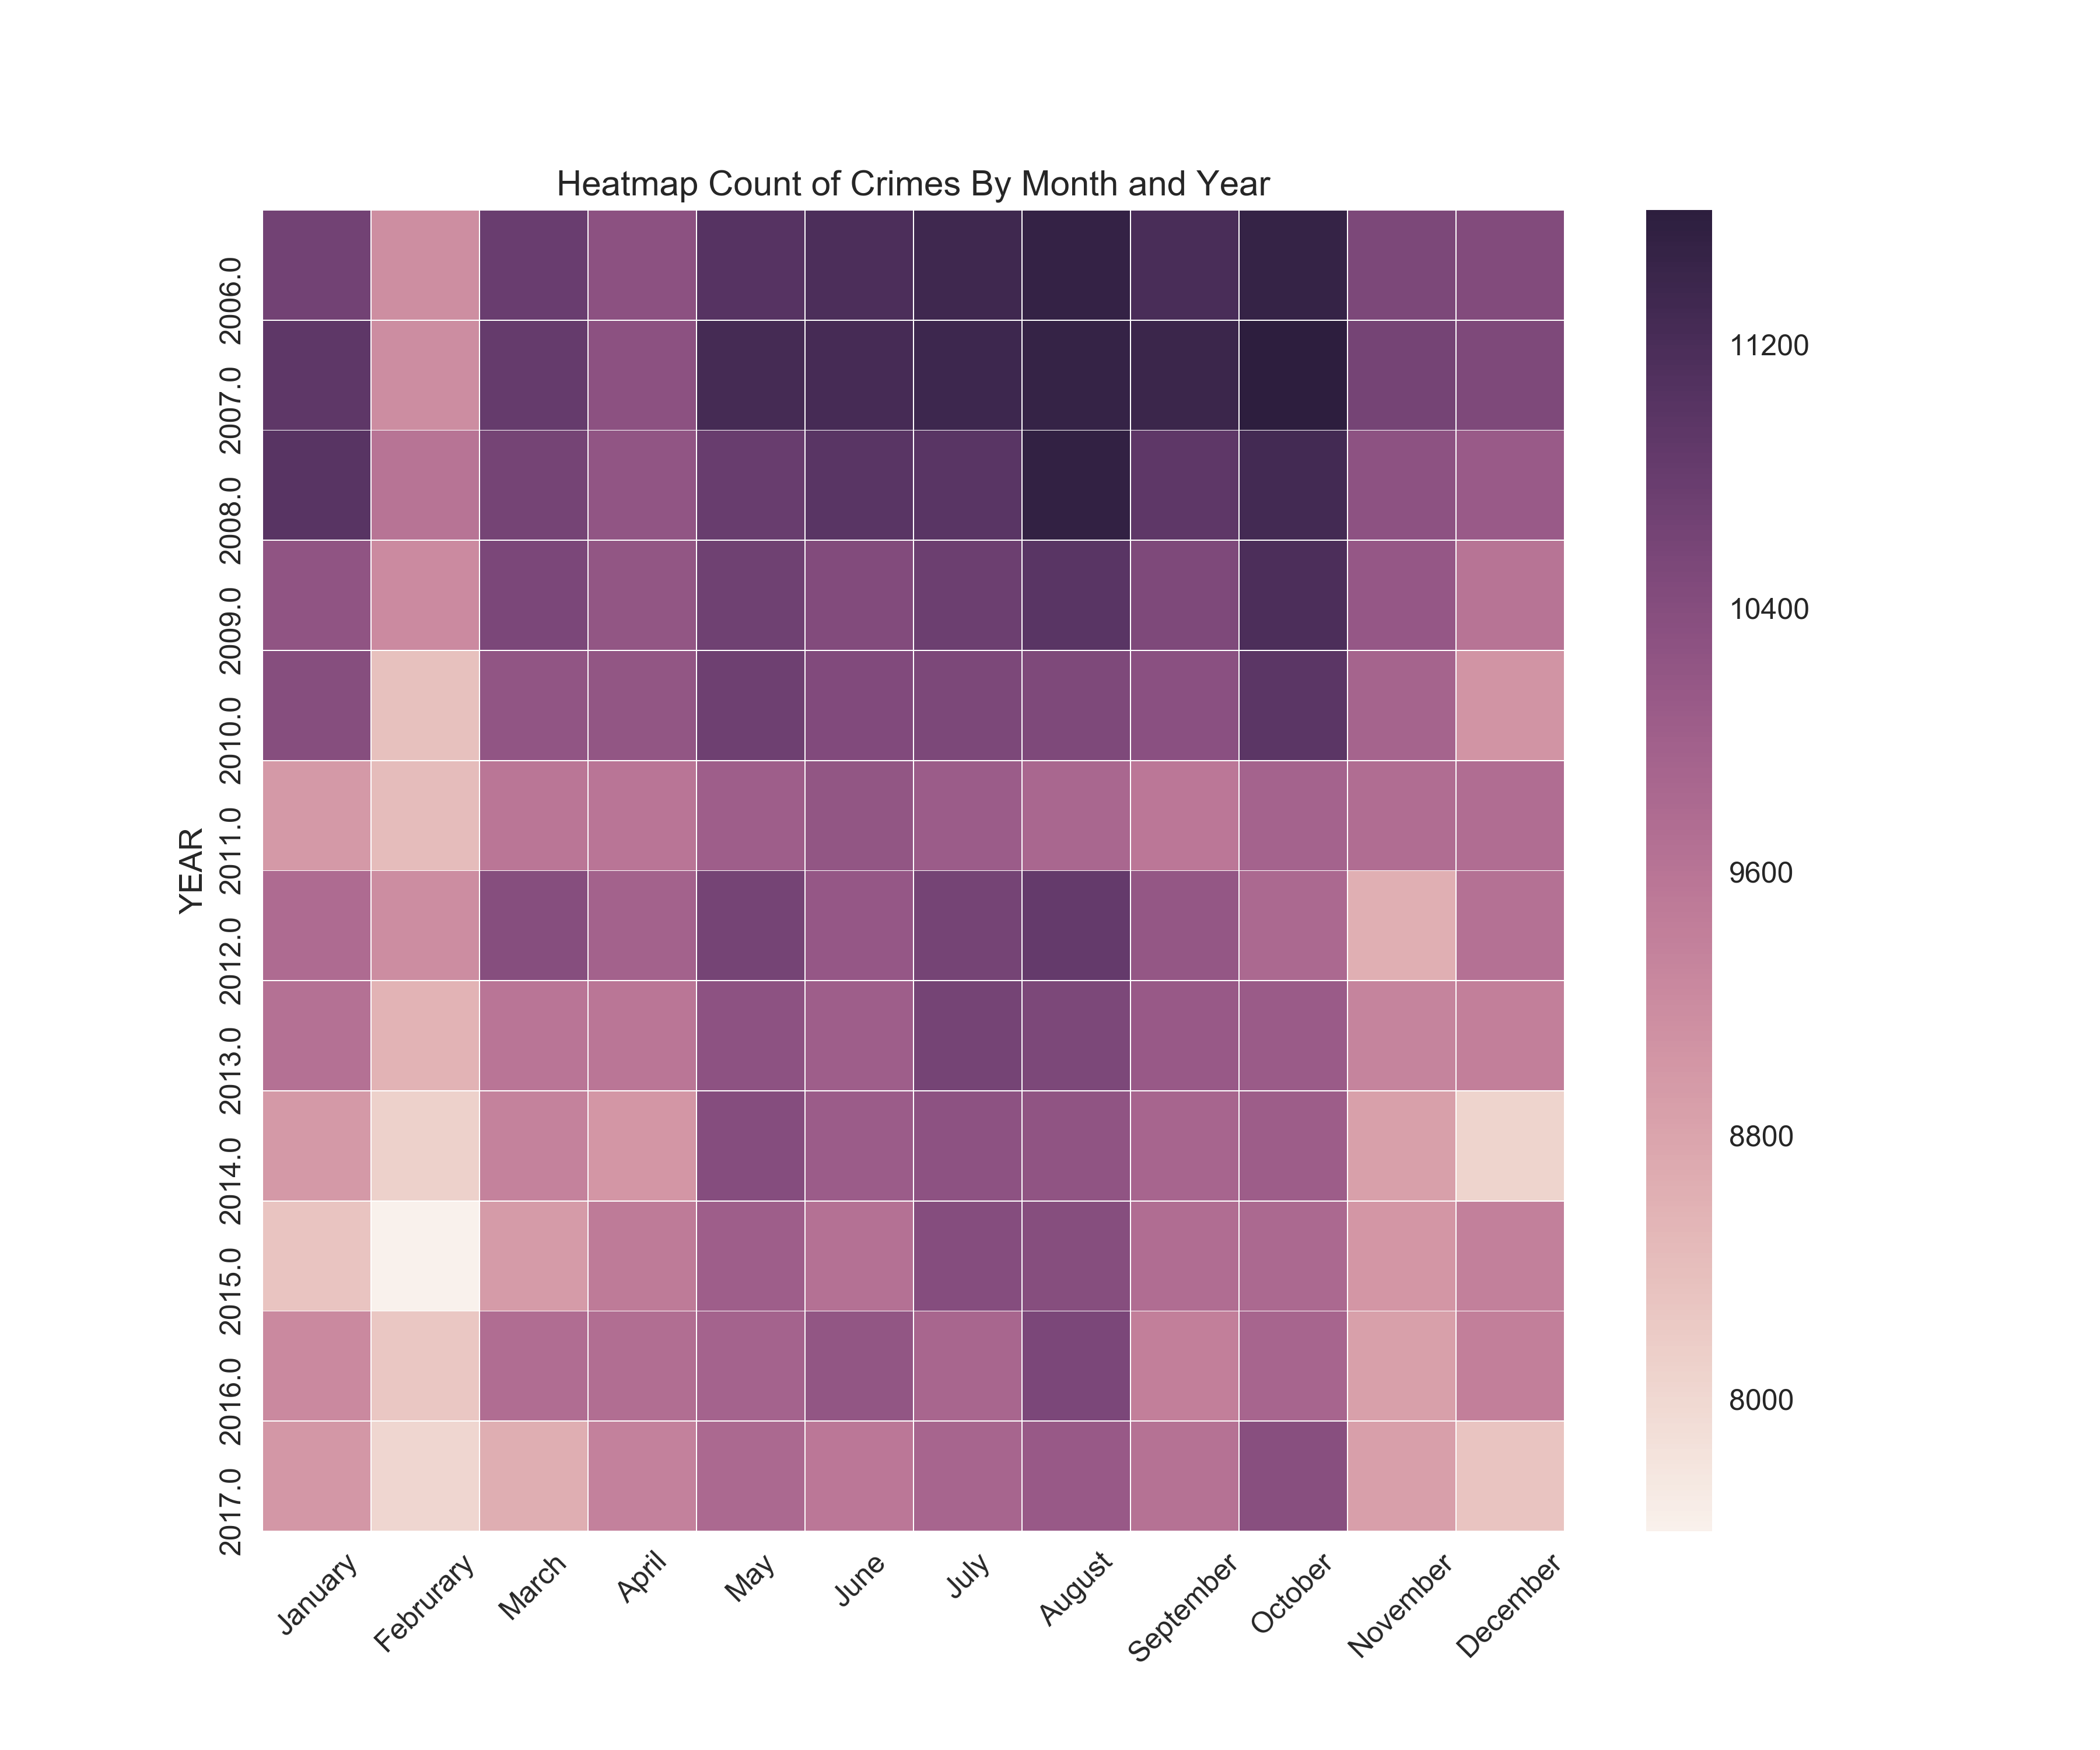
Exploring into the theme of higher crime in warmer months, I created a heatmap showing the
count of criminal violations by year and month. You can observe the increased intensity in
the warm summer months versus the winter. Also note the general decline in the
count of crime over the years from 2006 to 2017. The year will play a role later in our
analysis as we do a multilevel regression on this data.
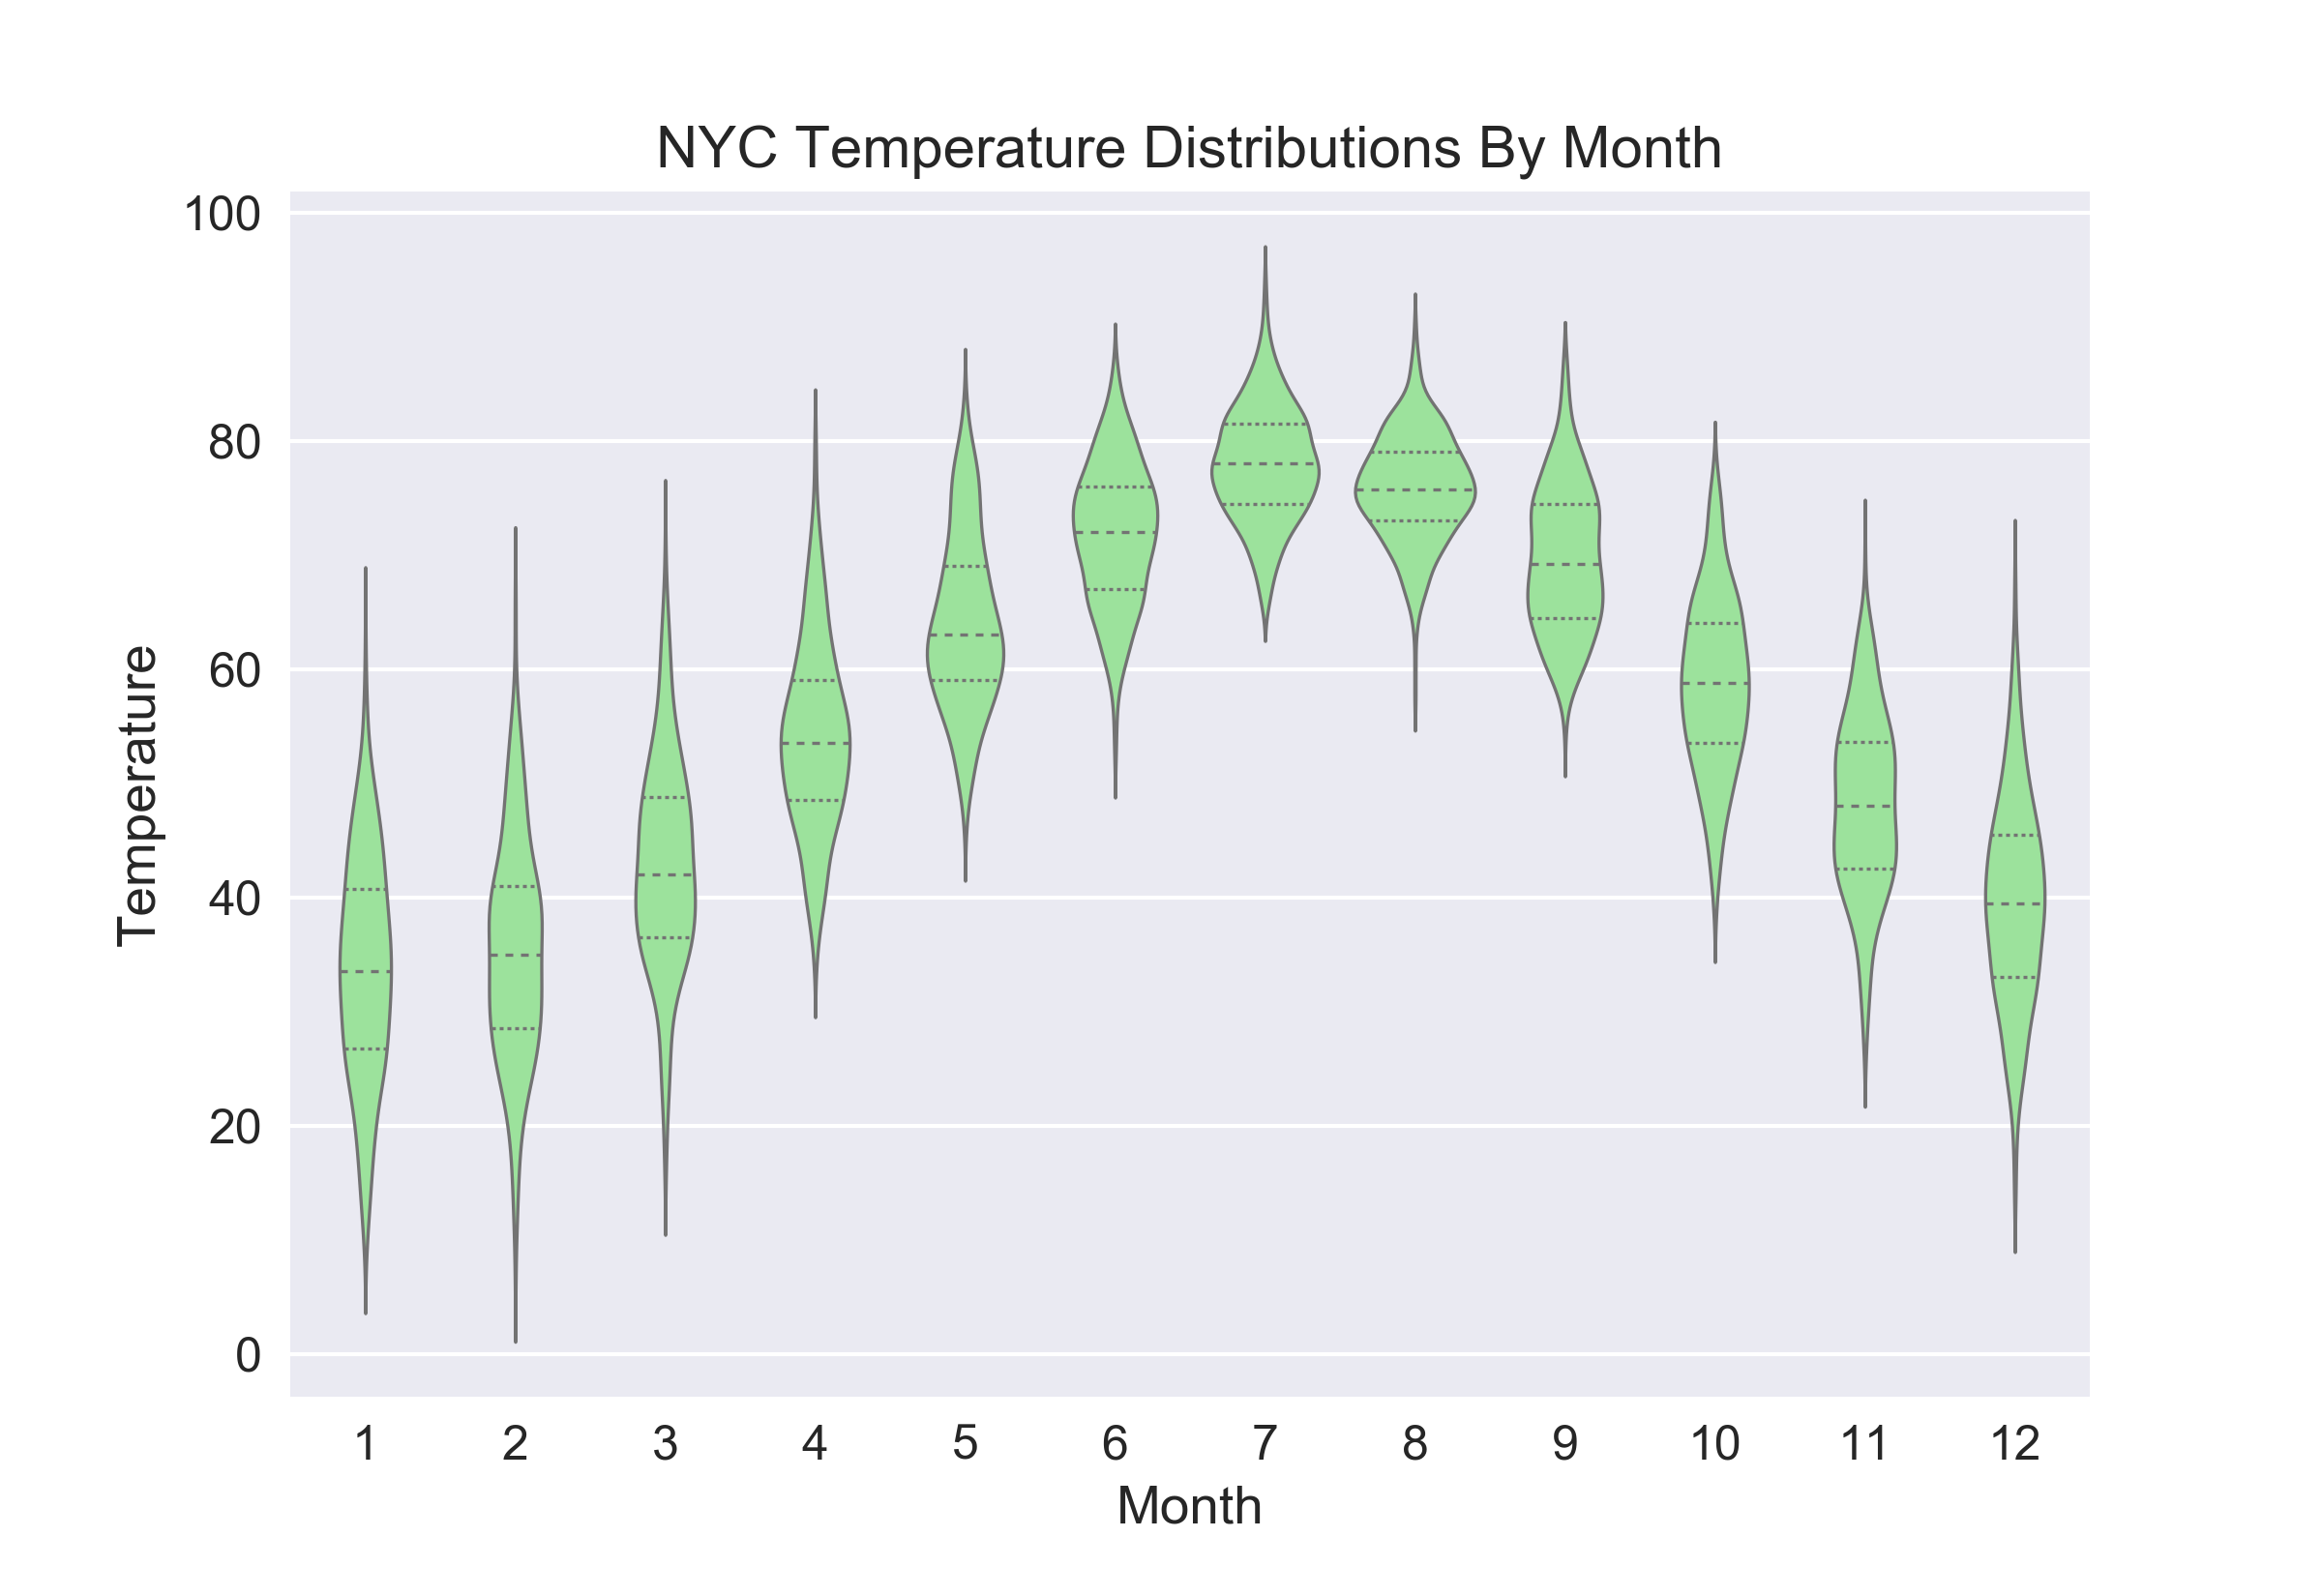
Switching gears to take a look at our weather data, I used a violin plot to observe the temperature distribution from month to month. For some reason, the data from NOAA consistently recorded daily Highs and Lows, without always giving daily averages. While not completely accurate, I ballpark these averages by finding the daily midpoints between the High and Low, as a variable named TMID. This is the value that went into the violin plot.
Results are as you would expect, although greater
variance in the edges may be surprising to some. Overall though it can be said that New York
City has a fairly classic cycle of temperature flutuations across the year, similar to what
you would find in many other big American cities.
Modeling And Analysis
Leveraging on the power of seaborn, it's quite straightforward to look at
possible linear relationships between specific types of crime against weather. As a
preliminary example, we can observe a simple relationship between PETIT LARCENY against
the TEMPERATURE in our data. I chose PETIT LARCENY for the density in the number of events
in this
period, but as we'll see later, this pattern is repeated consistently for other criminal
complaints. seaborn.lmplot() gives a simple regression line for this data.
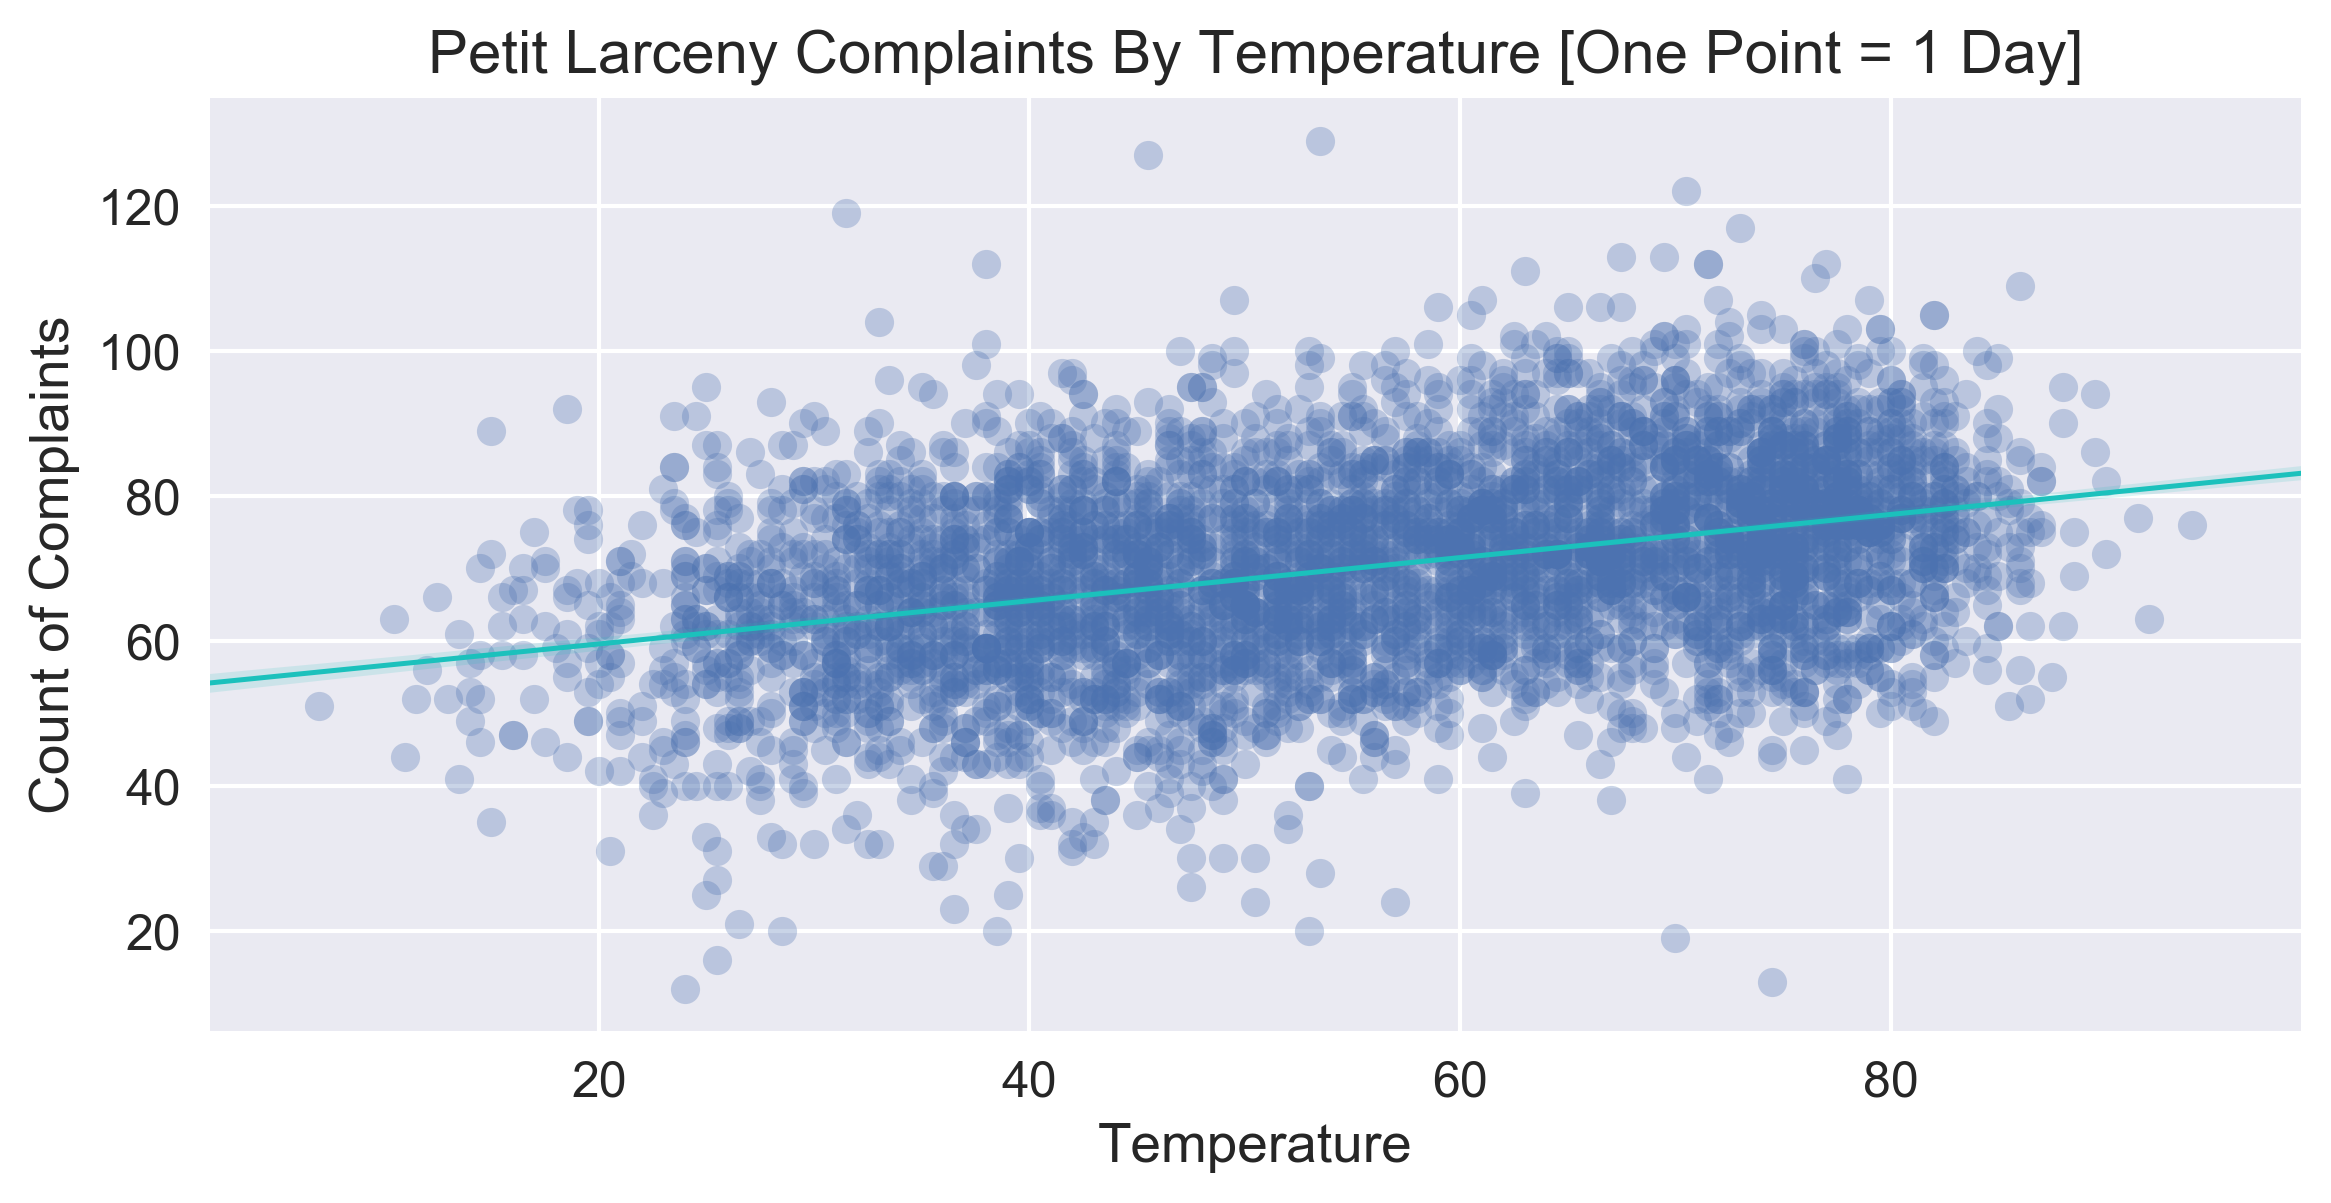 To get a little bit more precise on this line, I run a simple OLS model
here for the data. The coefficient for the X vector TMID was found to be 0.2978,
with a t-value of 26.357. In other words, for every ten degree
increase in temperature, there is an increase of just under three criminal complaints on
petit larceny.
To get a little bit more precise on this line, I run a simple OLS model
here for the data. The coefficient for the X vector TMID was found to be 0.2978,
with a t-value of 26.357. In other words, for every ten degree
increase in temperature, there is an increase of just under three criminal complaints on
petit larceny.
                            OLS Regression Results
==============================================================================
Dep. Variable:                     ct   R-squared:                       0.137
Model:                            OLS   Adj. R-squared:                  0.137
Method:                 Least Squares   F-statistic:                     694.7
Date:                Mon, 13 Aug 2018   Prob (F-statistic):          3.11e-142
Time:                        14:00:12   Log-Likelihood:                -17402.
No. Observations:                4383   AIC:                         3.481e+04
Df Residuals:                    4381   BIC:                         3.482e+04
Df Model:                           1
Covariance Type:            nonrobust
==============================================================================
                 coef    std err          t      P>|t|      [0.025      0.975]
------------------------------------------------------------------------------
const         53.6132      0.662     80.947      0.000      52.315      54.912
TMID           0.2978      0.011     26.357      0.000       0.276       0.320
==============================================================================
Omnibus:                       43.128   Durbin-Watson:                   1.627
Prob(Omnibus):                  0.000   Jarque-Bera (JB):               67.870
Skew:                          -0.062   Prob(JB):                     1.83e-15
Kurtosis:                       3.597   Cond. No.                         200.
==============================================================================
Recalling the heatmap from earlier, we saw that the trend of crime changes
from year to year, and NYC has enjoyed a prolonged general decline in crime
rates for the past few decades. Specifically as it relates to the data available,
we can observe whether Year should be treated as a categorical random effect to
allow for different intercepts on different years. Going forward with the
PETIT LARCENY example, we can get an improved view of yearly complaints with a
boxplot.
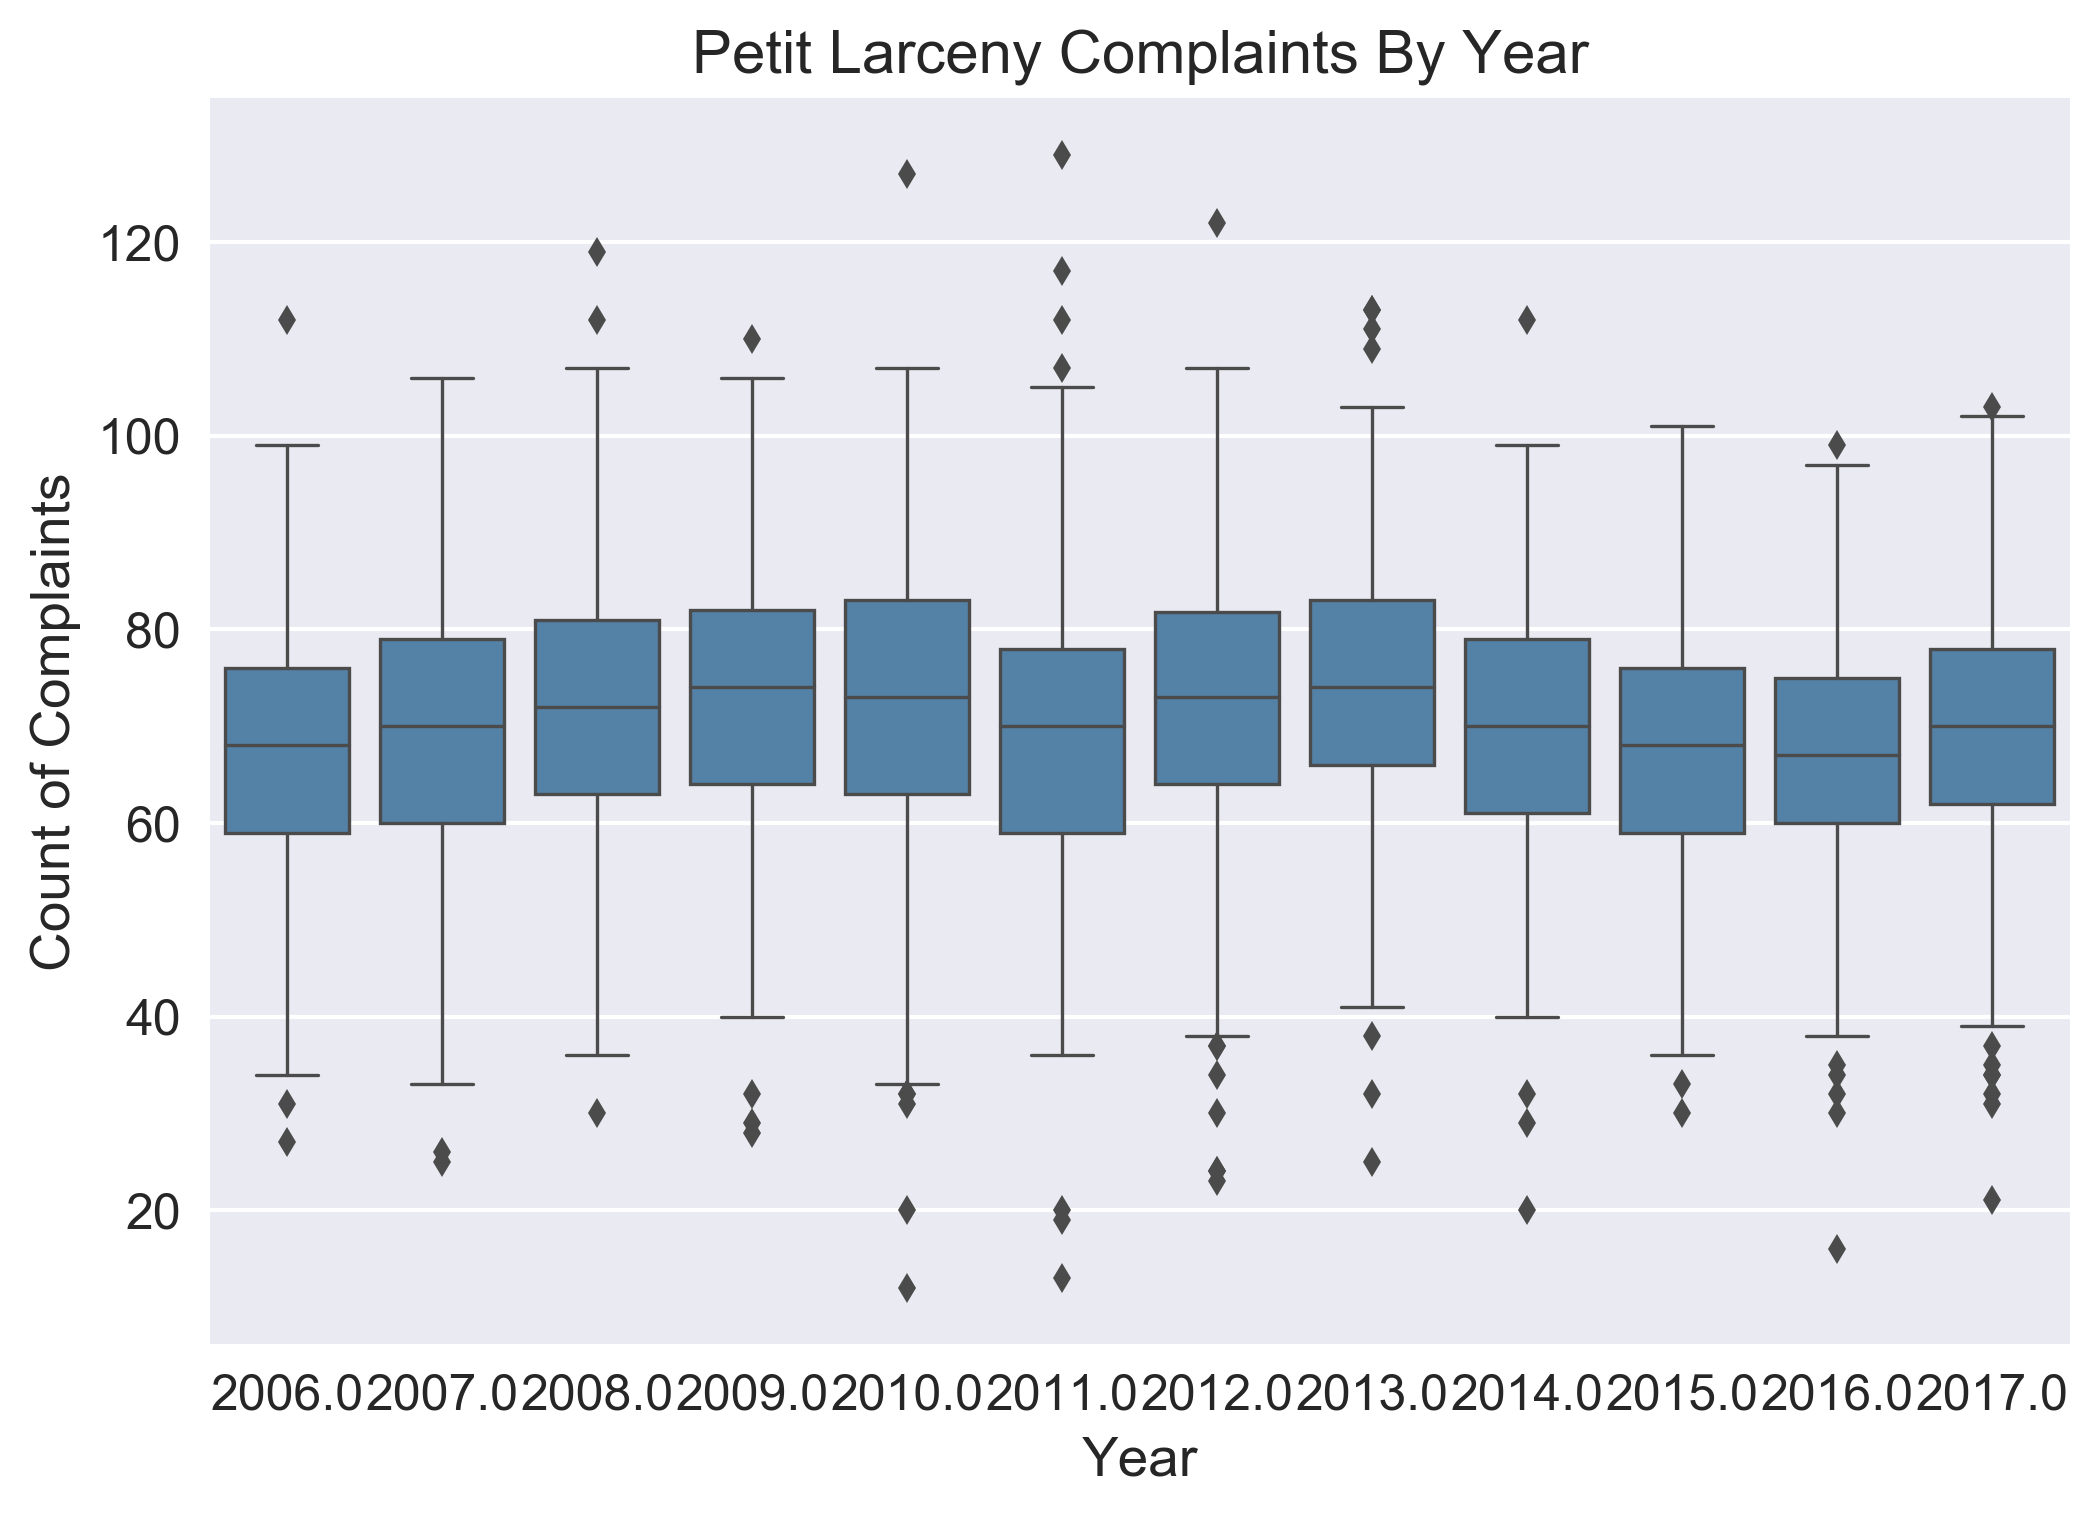
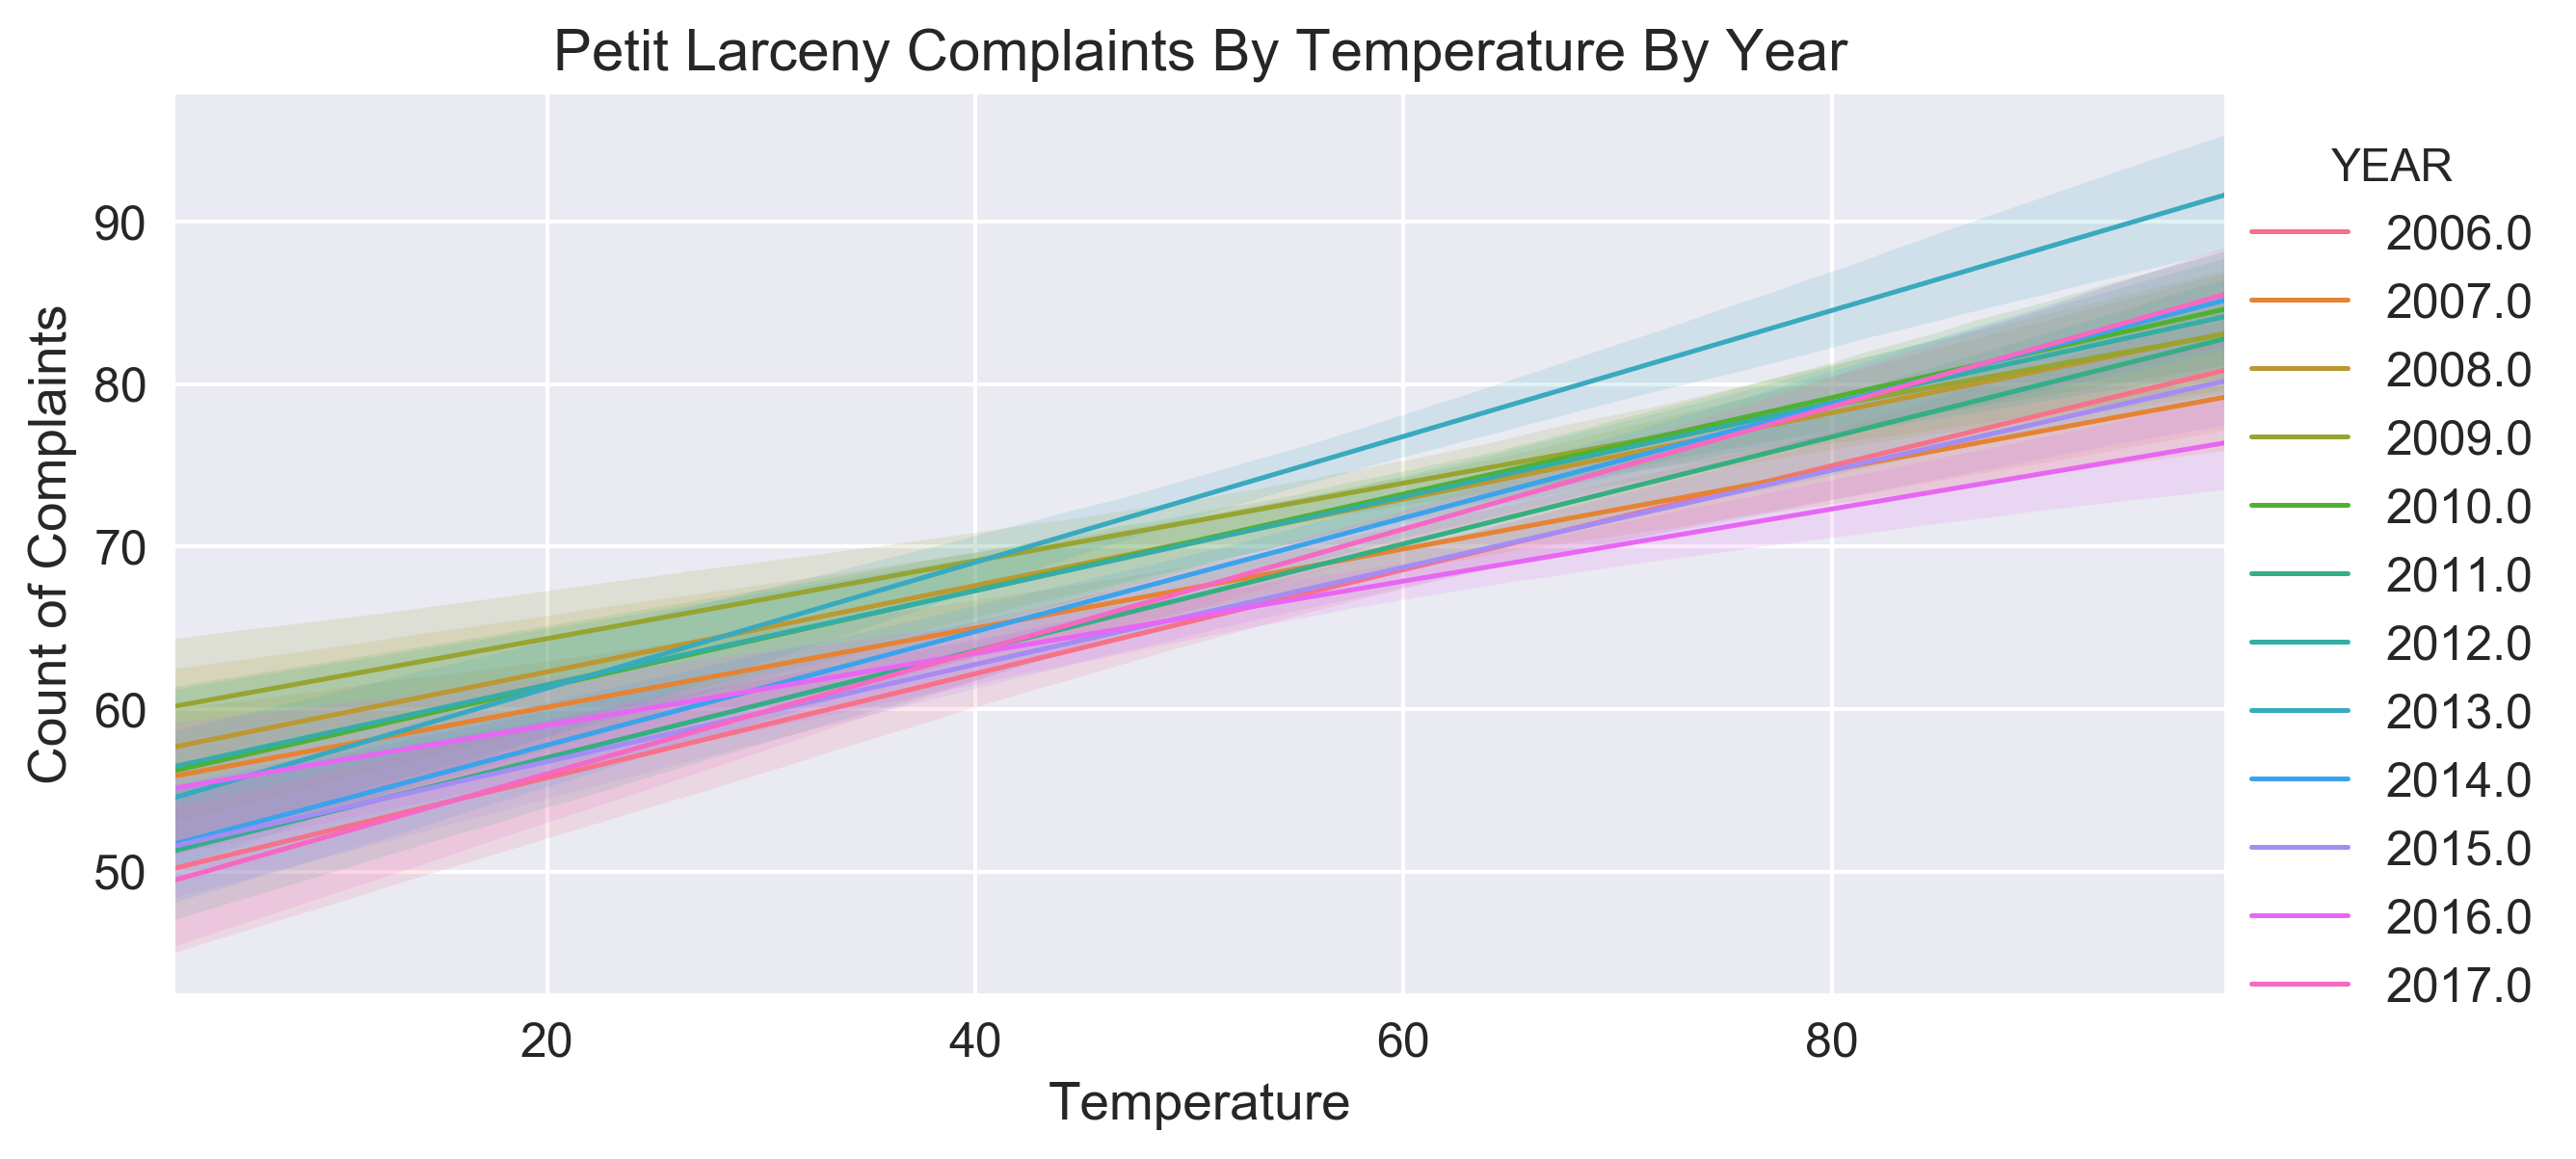
The differences in this case are minimal. However, we can model these yearly
differences by assuming different random intercepts for each year. To better illustrate
how this would look,
seaborn.lmplot() has a
nifty hue parameter than can break this down from the perspective of
a mixed linear model:
So far, we have looked at the prediction of PETIT LARCENY in the city and found
evidence for the positive relationship between higher temperatures to more criminal
complaints (as it relates specifically to petit larceny). We can look more generally
at the effect of crime by temperature, while allowing for different intercepts by year.
Leveraging mixedlm() from statsmodels.formula.api to model
ALL crime data grouped yearly, we find that a 10 degree increase in temperature
translates into approximately 9 additional criminal complaints.
The specifics of these results can be observed here:
              Mixed Linear Model Regression Results
=========================================================
Model:            MixedLM Dependent Variable: ct
No. Observations: 4383    Method:             REML
No. Groups:       12      Scale:              1941.1090
Min. group size:  365     Likelihood:         -22835.0639
Max. group size:  366     Converged:          Yes
Mean group size:  365.2
---------------------------------------------------------
             Coef.  Std.Err.   z    P>|z|  [0.025  0.975]
---------------------------------------------------------
Intercept   276.383    5.883 46.980 0.000 264.853 287.914
TMID          0.938    0.039 24.126 0.000   0.862   1.014
groups RE   353.023    3.473
=========================================================
Conclusions And Additional Works
There are a lot of places I can go this. For example, temperature is just one aspect of weather that is correlated to crimes reported in a city. Looking at the steep slope of crime based on precipitation:
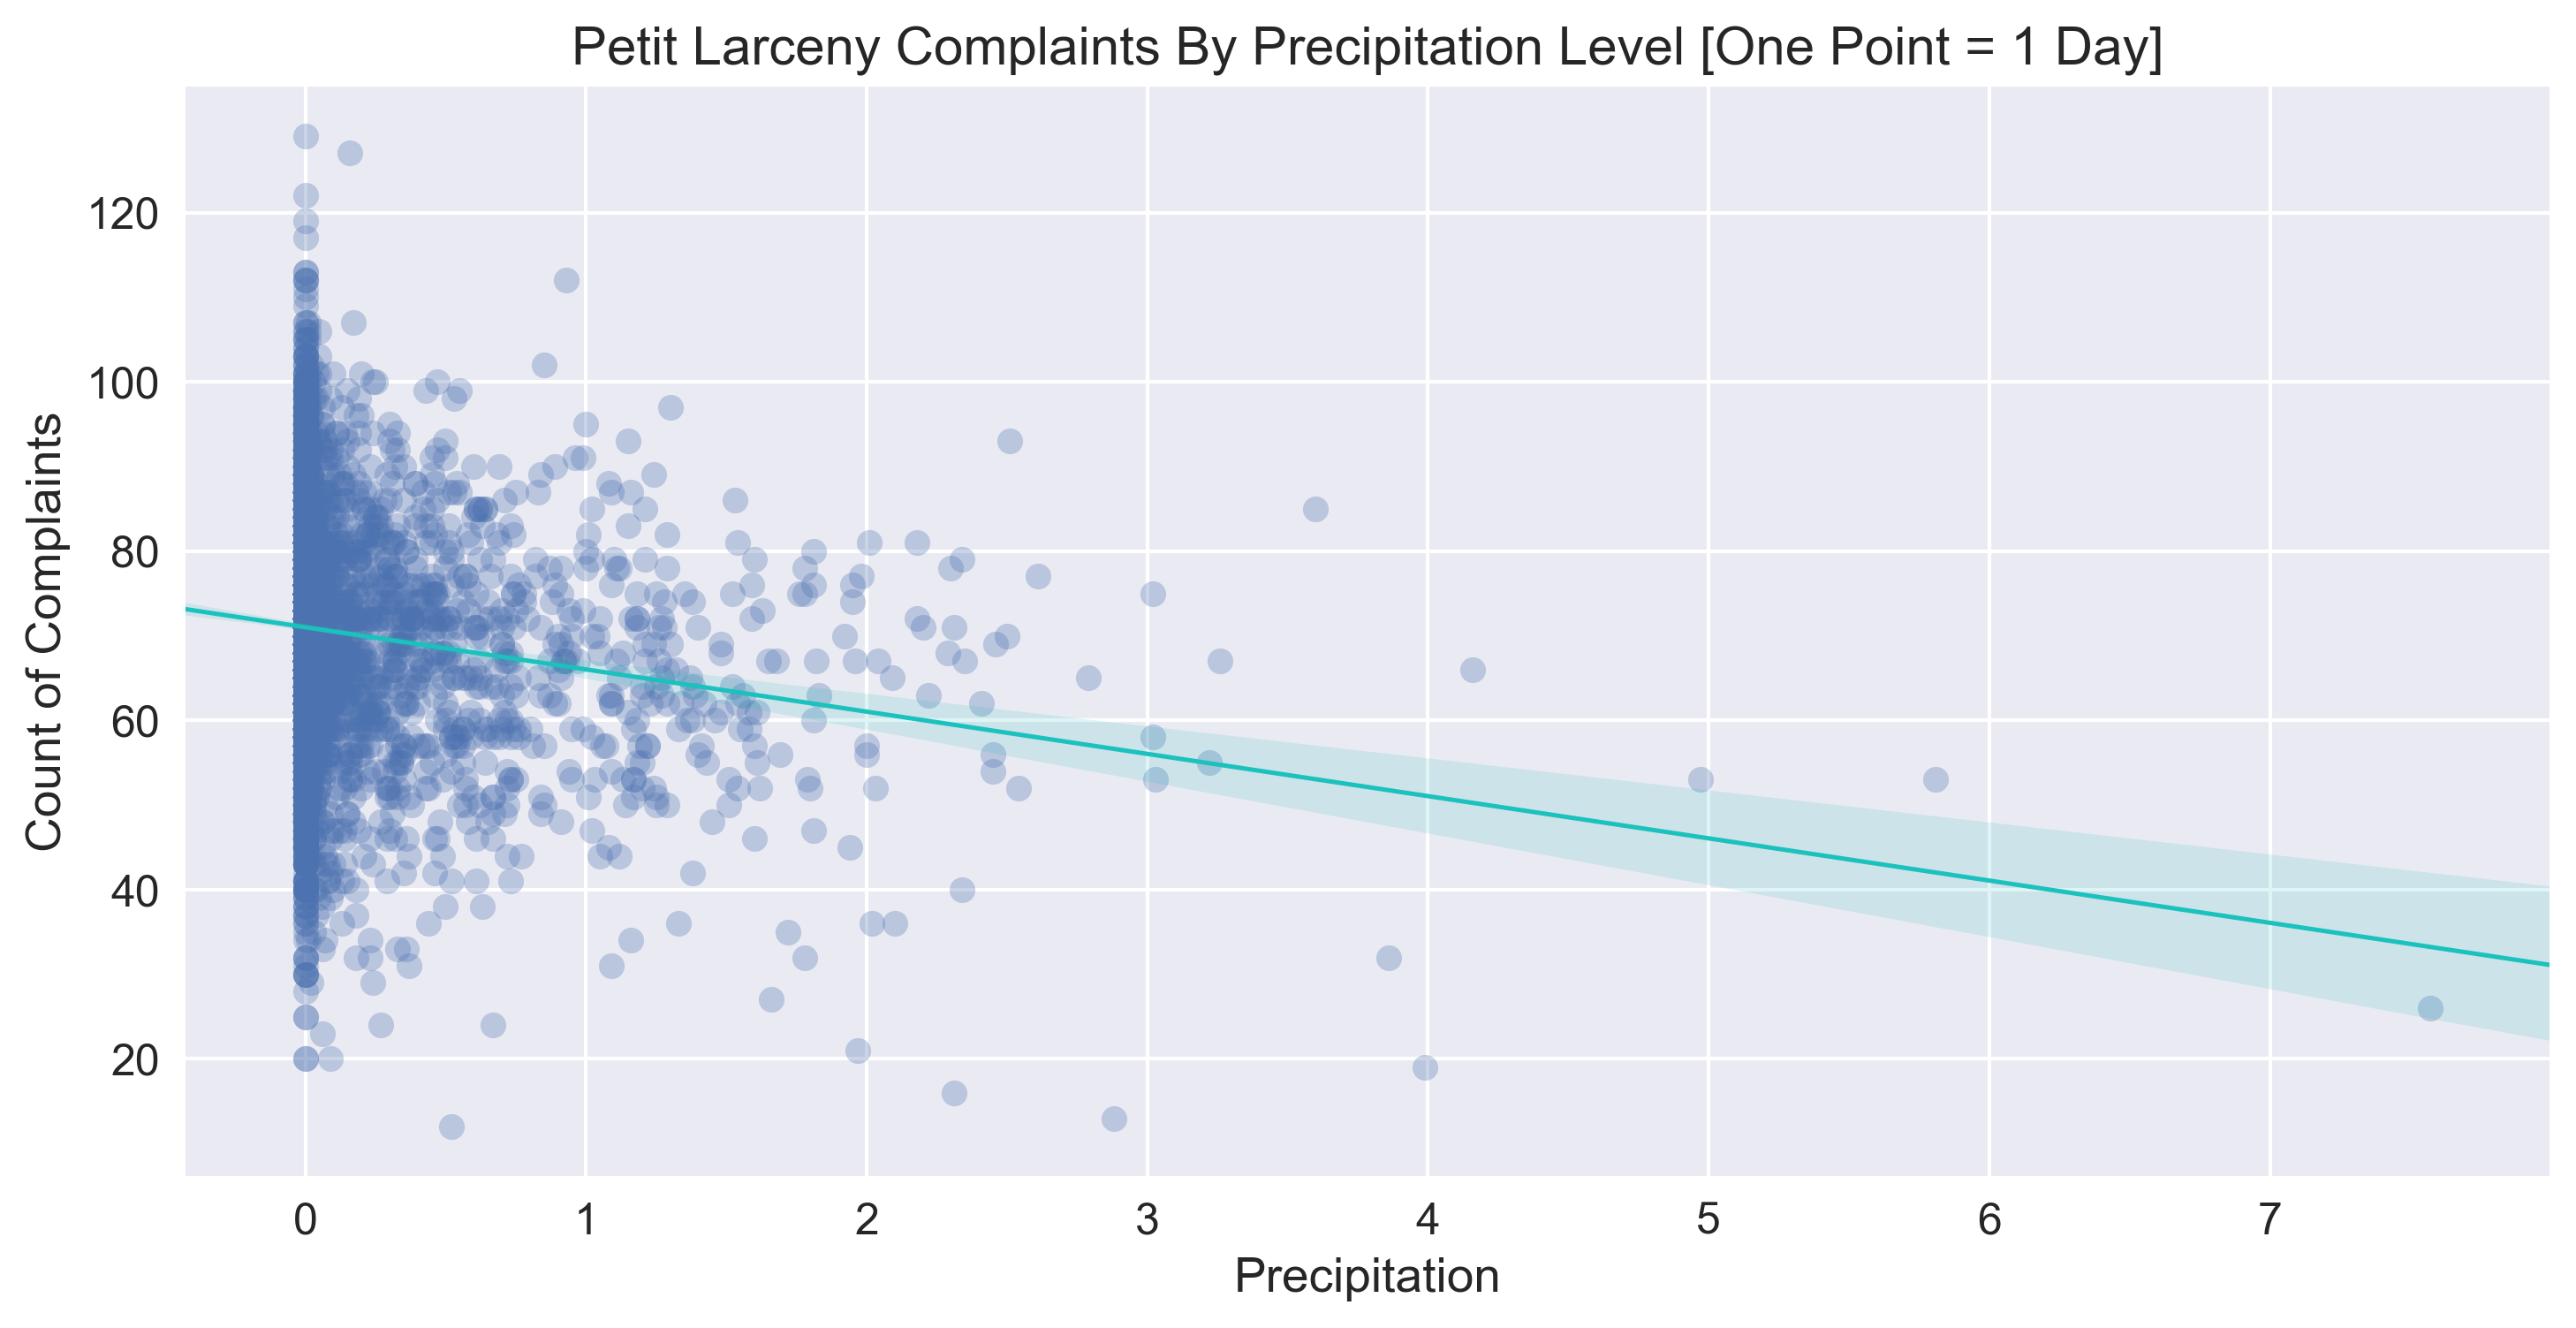
I definitely see potential for more interesting models ahead, but as this is a project specifically concerning temperature, I'll leave these other factors to a future post.